Article
An aircraft's arrival is also the starting point for its next rotation. For an airline operations centre, predicting that arrival helps assess connections, prepare ground resources and understand whether the next departure remains achievable.
But when is a prediction good enough to support those decisions?
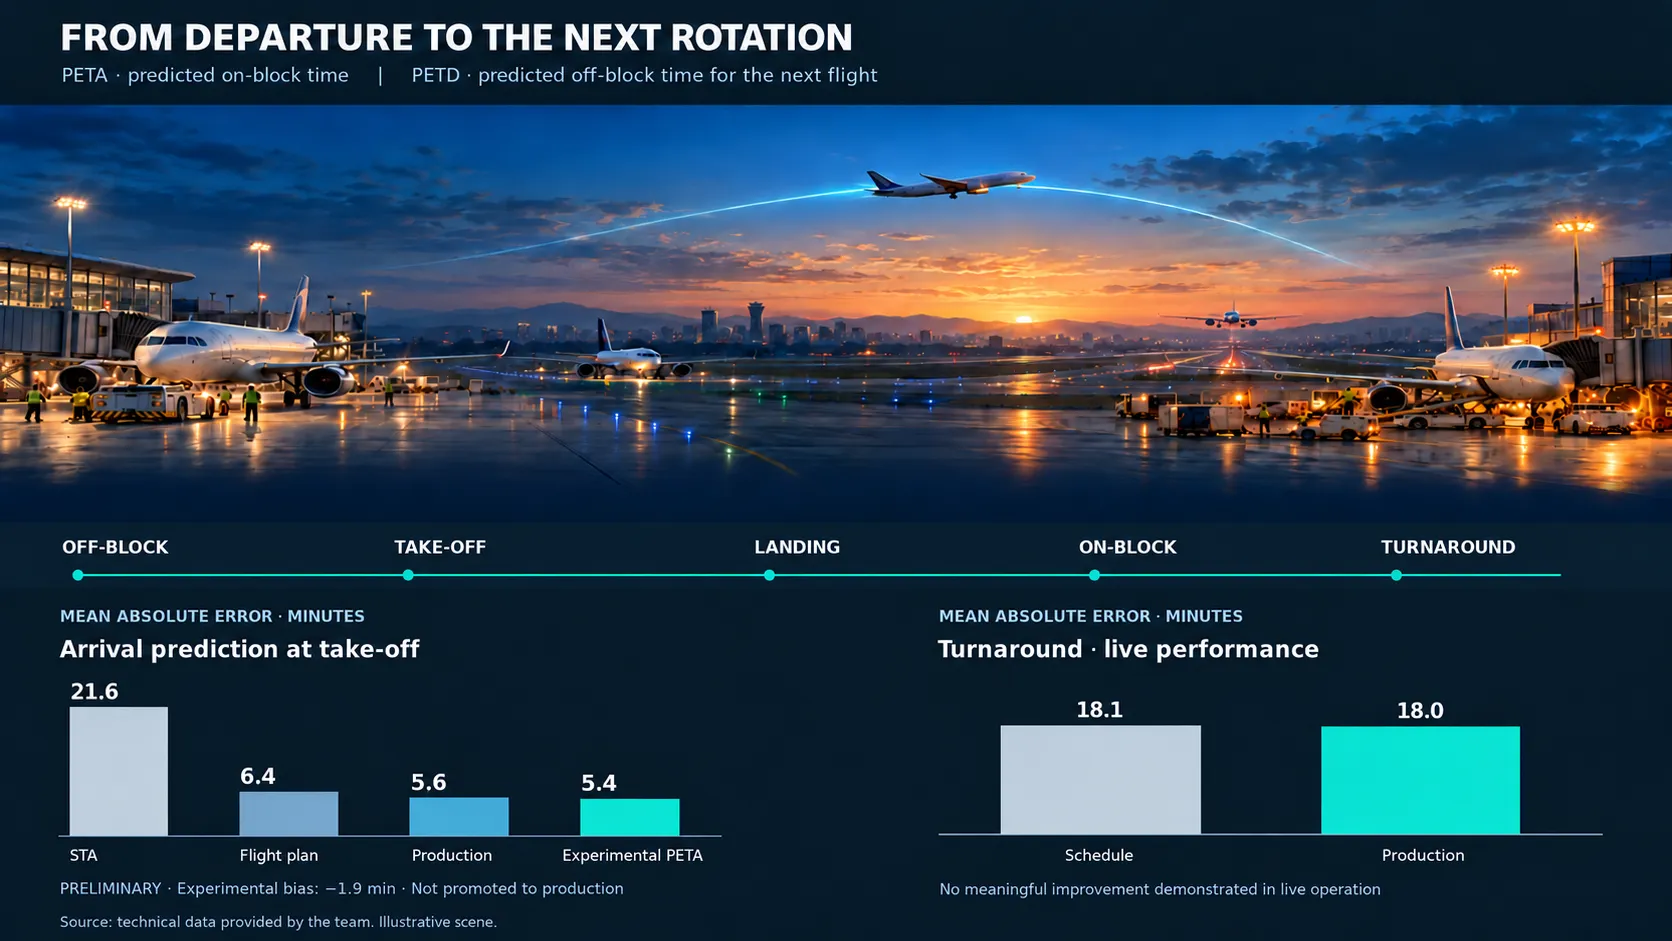
Our latest preliminary evaluation illustrates the challenge. At take-off, the best experimental arrival prediction has a mean absolute error of 5.4 minutes, compared with 6.4 minutes for the flight-plan baseline and 21.6 minutes for scheduled arrival.
That is a meaningful improvement in accuracy. Yet the experimental model has not replaced production: it also has a systematic tendency to predict arrivals too early.
The operational question is therefore broader than "Which model has the lowest error?" It is "Which prediction can we rely on, at this moment, for this decision?"
One rotation, several sources of uncertainty
Two connected predictions help describe the aircraft's progress through a rotation.
PETA is the predicted on-block time: when the aircraft is expected to reach its parking position. Before take-off, it incorporates taxi-out, airborne time and taxi-in. As the flight progresses, actual timings replace completed segments.
PETD is the predicted off-block time: when the aircraft is expected to leave its parking position for the next flight. It considers the previous arrival and the turnaround required before departure.
This connection matters. An accurate airborne-time estimate does not guarantee an accurate arrival at the stand. Equally, a better arrival prediction does not automatically produce a better departure prediction. Ground movements and turnaround introduce their own uncertainty.
We have been examining these components through five models: two approaches to airborne-time prediction—XGBoost and FT-Transformer—and XGBoost models for taxi-out, taxi-in and turnaround.
Their purpose is to improve the information available to operations. Each must earn its place against an existing baseline.
What the arrival results show
Mean absolute error, or MAE, measures the average size of a prediction error, regardless of whether the prediction is early or late.
The current preliminary comparison is:
| Arrival prediction made at | Best experimental PETA | Best production PETA | Flight-plan baseline | Scheduled arrival |
|---|---|---|---|---|
| Take-off | 5.4 min | 5.6 min | 6.4 min | 21.6 min |
| Off-block | 6.5 min | 6.7 min | Not available | 21.6 min |
At take-off, the experimental prediction has approximately one quarter of the scheduled arrival error. It also improves on the flight-plan baseline by around one minute.
These comparisons answer different questions. The schedule describes the intended operation; the flight plan provides a more specific operational reference. Improving on the flight plan is therefore an important test of the model's additional contribution.
At off-block, this evaluation has no direct flight-plan reference. We cannot claim an improvement against a baseline that was not measured.
We also examine MAE80, which excludes the worst 20% of cases. The experiment achieves 3.2 minutes at take-off and 3.9 at off-block, compared with 3.5 and 4.2 in production. This helps describe performance in the more predictable cases, but cannot replace scrutiny of the difficult ones.
Why a lower error can still be insufficient
Average accuracy does not reveal the direction of an error.
The best experimental candidate has a bias of −1.9 minutes at take-off and −1.8 minutes at off-block: it tends to predict an arrival earlier than it occurs.
For operations, that direction matters. Consider a connection with little remaining margin. A consistently optimistic arrival prediction could make the connection appear more achievable than it is. For a tightly planned rotation, the same tendency could overstate the time available for turnaround.
These are illustrative consequences, not measured outcomes of this evaluation. They explain why systematic bias is assessed separately from average error.
The experimental model remains outside production because it fails that acceptance criterion. The lower MAE is encouraging; it is not sufficient evidence for deployment.
Sometimes the existing plan is the better answer
The taxi results show why a prediction system should be selective.
For taxi-out, the production model achieves an MAE of 3.06 minutes, compared with 3.70 minutes for the operational flight plan—an improvement of approximately 17%.
Most of the benefit occurs outside the hub, where the comparison is 3.25 against 4.43 minutes. At the hub, performance is approximately in line with the plan.
Taxi-in provides a different lesson. Production achieves 1.96 minutes, the experiment 1.95 and the flight plan 1.94. Even with eight times more data, the model has not demonstrated an advantage.
The engine therefore retains the flight plan's taxi-in estimate up to take-off.
A useful operational system does not need a model to win every comparison. It needs to use the strongest available evidence for each component.
Better arrivals do not automatically mean better departures
Turnaround is where the limits of prediction become particularly visible.
Early offline tests showed an error of 17.7 minutes against 19.9 for the schedule. A later phase-specific model reached 15.7 minutes offline. Those results suggested potential, but a meaningful improvement has not been established in live operation.
Some rotations also require different treatment. Overnight stops longer than six hours and rotations without time pressure use the schedule, limiting how often the predictive model is applied.
The difficult cases include operational delays. The current live model does not yet use arrival delay as an input, leaving an important part of the rotation's context unrepresented.
The lesson is straightforward: a model can perform well in a historical test while still lacking information needed in the operating environment. Better PETA provides a stronger input to PETD; it does not resolve the turnaround problem on its own.
The most useful improvements may be in the data
Some of the airborne-time gains came from restoring route-history and aircraft-type information that was not reaching the model correctly during prediction.
This exposes a practical requirement: a model must receive information in operation that is consistent with what it learned from during training.
The timing of that information matters just as much. A later flight update cannot legitimately be used to judge what could have been predicted earlier.
Other additions did not earn their place. Weather inputs did not improve taxi performance sufficiently, and fleet-based turnaround segmentation delivered no gain.
Adding information or complexity is not progress unless it improves the prediction under the conditions in which it will actually be used.
From prediction accuracy to operational confidence
For an OCC or IOCC, evaluating a prediction capability means asking:
- How accurate is it at the moment a decision must be made?
- Does it systematically predict too early or too late?
- Where does it improve on the existing operational baseline?
- Does the improvement hold in live operation?
- What happens in the difficult cases?
These questions connect model performance to operational usefulness.
The results so far support a selective approach: use models where they demonstrate value, retain existing baselines where they remain stronger, and require live evidence before extending claims.
A better prediction gives the operations team a clearer view of what may happen next. Understanding its limitations helps determine what to do with that view.
If your airline or hub is exploring how predictive models can support operational decisions,contact usto discuss the evidence that should sit behind them.