Skip the animated introduction

PREDICTIVE OPERATIONS PLATFORM

Predictive Operations Platform

A continuously updated view of when every flight will leave the gate, take off and arrive — with uncertainty made visible and operational decisions kept in human hands.

  • Anticipate disruption
  • Understand every estimate
  • Decide with the network in view

Scroll to follow the operation ↓

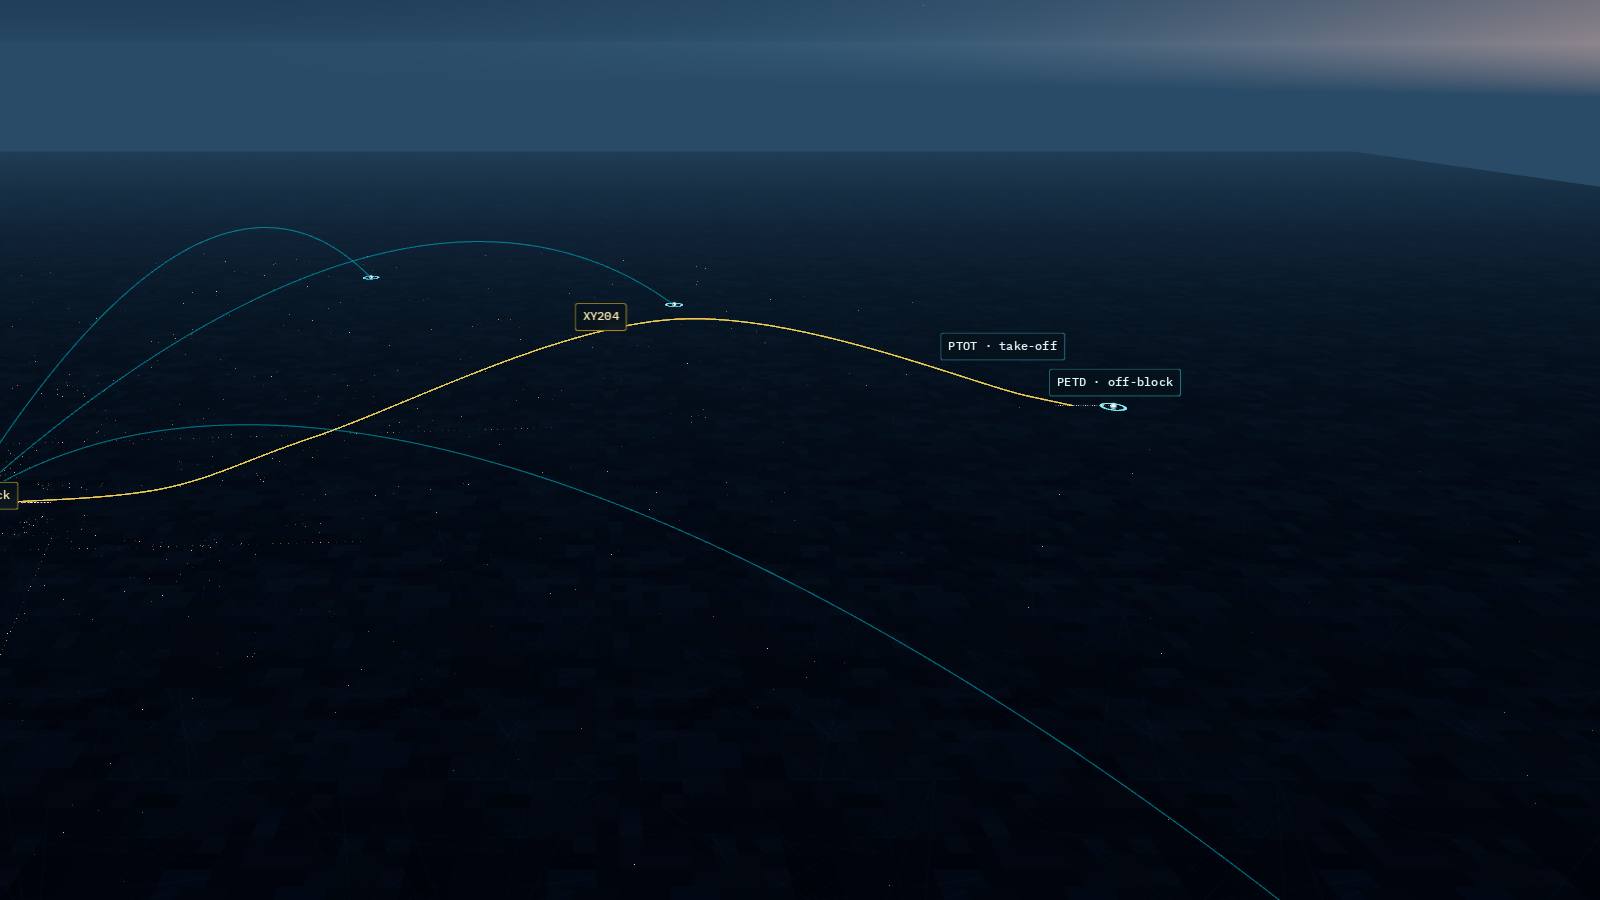
PETD → PTOT → PETA

One estimate chain per flight.

Predicted off-block (PETD), predicted take-off (PTOT) and predicted on-block (PETA) form one connected chain, each falling back to the next-best known time. A real event always overrides a prediction.

ILLUSTRATIVE EXAMPLE

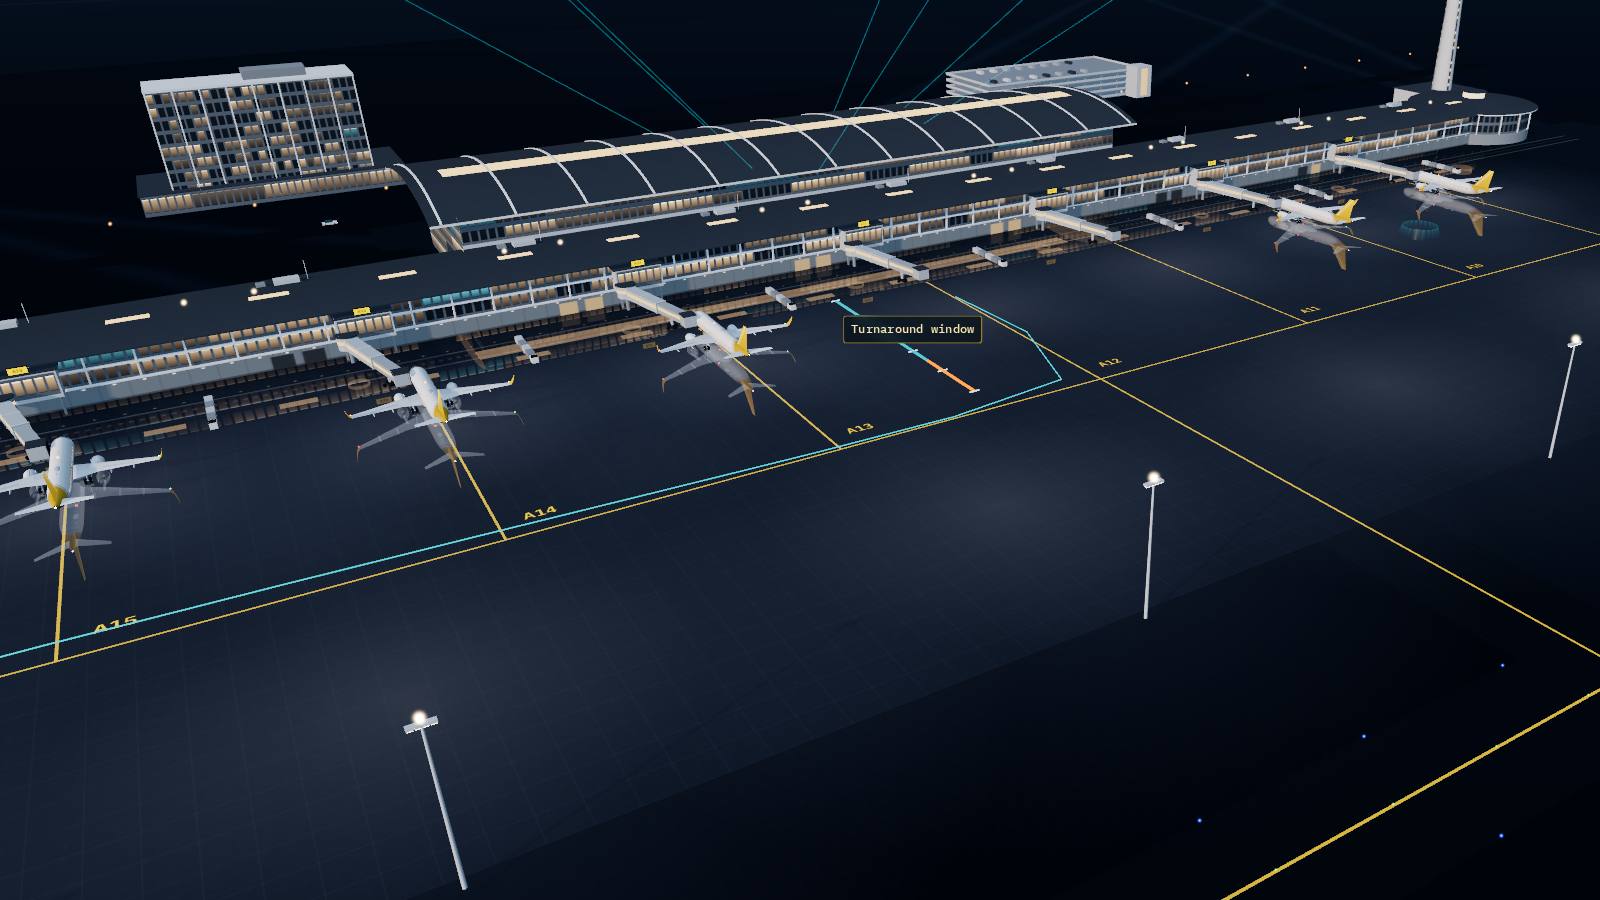
A revised arrival moves with the aircraft.

When an inbound arrival changes, the estimate propagates automatically to that aircraft’s next flights. If the aircraft recovers time during turnaround, the next departure can recover time too — never earlier than its own schedule.

ILLUSTRATIVE EXAMPLE

Uncertainty narrows as the flight progresses.

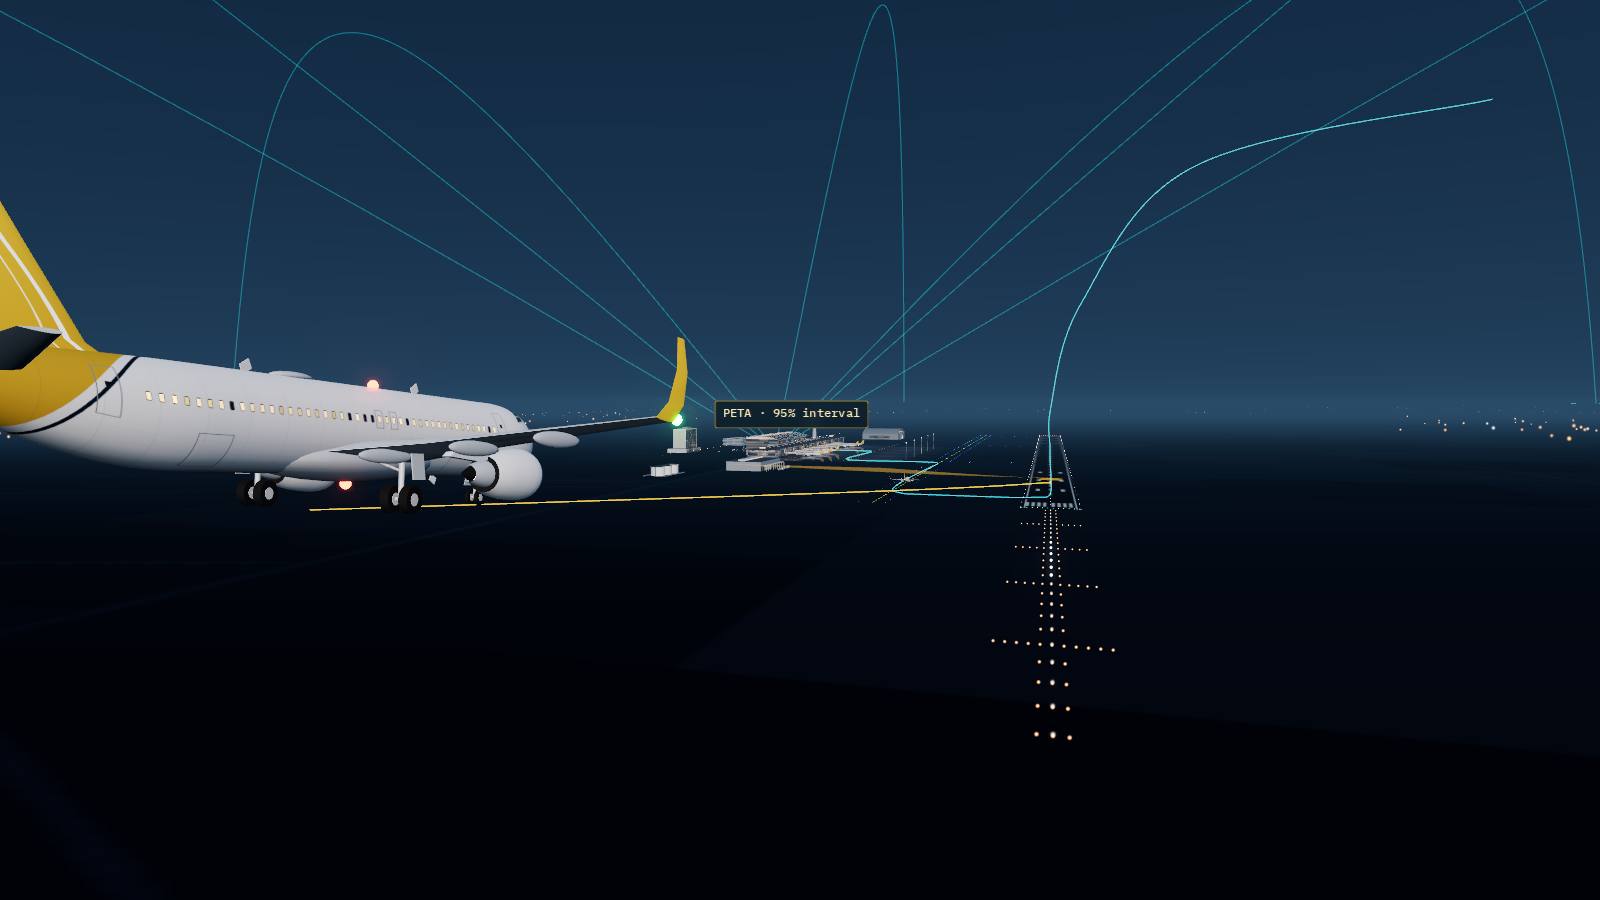
A 95% prediction interval around PETA and PETD narrows as a flight moves through its phases — not every flight follows an identical curve, and once a milestone has actually happened, the real event replaces the interval.

A continuously updated estimate chain, uncertainty made visible, and every operational decision kept in human hands.

How the platform works, in one paragraph

The platform combines the operational plan with three specialised prediction models. Every relevant event updates the estimate. When a flight is projected late, a decision case brings together the context and options for people to approve.

The operational problem

Individual numbers don’t communicate the full uncertainty.

Operations teams work with scheduled times, flight-plan estimates and manual updates — useful on their own, but incomplete together.

One estimate chain per flight

PETD, PTOT and PETA — and the sources behind each one.

PETD — predicted off-block time. PTOT — predicted take-off time. PETA — predicted on-block time at destination. Every stage follows the same principle: a real event always overrides a prediction.

PETD — how it’s determined
  1. Actual off-block time.
  2. Target start-up approval time (TSAT), then target off-block time (TOBT), where published.
  3. Aircraft rotation: the inbound aircraft’s predicted on-block time plus predicted turnaround, applied only when materially later than the current estimate and rounded to the operational planning grid.
  4. Latest estimated departure, then scheduled departure.

A predicted departure must never be earlier than scheduled departure. If the inbound aircraft recovers time, the next flight can recover too, down to its own schedule.

PTOT — how it’s determined
  • At the stand: PETD plus predicted taxi-out, or calculated take-off time (CTOT) if later.
  • After pushback: actual off-block plus predicted taxi-out. CTOT no longer constrains the calculation.
  • Airborne: actual take-off time.
PETA — how it’s determined
  • Before landing: PTOT plus planned airborne time, the airborne model’s correction and predicted taxi-in.
  • After landing: actual landing plus predicted taxi-in.
  • At the destination gate: actual on-block time.

The airborne-time baseline comes from the operational flight plan. Without one, the route’s recent median airborne time is used, then scheduled block time minus planned taxi times. The airborne correction is applied only to a flight-plan baseline — applying it to a historical route median would correct twice.

Always current

Every relevant change places a flight in a recompute queue.

Changes to schedules, estimates, TSAT, TOBT, CTOT and actual movement events keep the chain current. Full model queries run when a flight is first seen, reaches a relevant phase, receives the inbound aircraft’s on-block event, changes aircraft, or retries an unavailable model. Every other update recalculates the chain quickly from stored model answers.

What else the platform keeps current
  • Automatic propagation to the same aircraft’s next flights.
  • Aircraft-swap handling for flights gaining and losing inbound links.
  • Recording aircraft changes in flight history.
  • Filtering impossible or incorrectly matched event timestamps.
  • Logging changes, sources and reasons.
  • Freezing snapshots at pushback and take-off to measure accuracy honestly at different horizons.

Three specialised models

Each model has its own scope and its own guardrails.

Airborne time

Predicts the deviation from the flight-plan airborne time — learns both faster and slower outcomes.

Technical detail
  • Uses flight-plan inputs, aircraft, route, time, season, and historical and recent operational behaviour.
  • Compares gradient-boosted trees and a transformer network for tabular data on live flights.
  • Caps corrections using historical evidence; without relevant history, applies no correction.
  • Training uses only information available at the prediction horizon.

Taxi-out and taxi-in

Learns deviations from planned taxi times, with a cautious, well-guarded fallback chain.

Technical detail
  • Excludes missing or impossible timestamps from training.
  • Prevents insufficient clean training data from replacing a working model.
  • Rejects implausible predictions.
  • Falls back to flight-plan taxi times, then typical station taxi times — the source used is recorded for each flight.

Turnaround

Predicts actual ground time between a specific arrival and the same aircraft’s next departure.

Technical detail
  • Uses strict arrival–departure pairing: the model answer is used only when its pairing matches the engine’s expected departure.
  • Considers scheduled ground time, aircraft family, arrival type and inbound delay — measured, before landing, with the estimate available at that moment, not the eventual actual arrival.
  • Applies the "no squeeze" rule: when at least the scheduled ground time is available, turnaround must not introduce a delay. Long and overnight stops are left on schedule.
  • Falls back to minimum ground time for the type, or no rotation push.

Uncertainty made visible

An empirically calibrated interval, not a guarantee.

Illustrative example

PETA 14:32

95% prediction interval: 14:21–14:50

Calibration groups
PhaseHorizon groups
At the standMore than 6h, 3–6h, 1–3h, under 1h to departure
Taxiing outOne group
AirborneMore than 2h, 1–2h, under 1h to arrival
LandedOne group

From prediction to decision

A case opens only when it matters — and only people approve it.

Nothing is executed without human approval.

Recovery and passenger impact

Options are evaluated — not assumed.

Recovering time in the air In evaluation

Compares a short list of speed settings above the planned setting, within the aircraft family’s historical operating evidence. Shows potential minutes recovered, extra fuel and a calibrated range. Excludes options without evidence or with negligible gains. Flying faster never shows less recovery.

Passenger connections Early stage

Estimates connection outcomes under the current plan and each option, translating flight delay into passenger impact. Today this is an empirical risk table, not a machine-learning model. Predicted missed connections are compared separately against actual passenger outcomes, both as operated and against the original plan.

Re-accommodation offers Pilot

Used when a missed connection is expected and there is no same-day seat on the airline’s own network. Searches direct flights only; selects the lowest total group price, breaking ties by earliest arrival then earliest departure. Flags hotel and meal needs for an overnight wait. Prices are indicative — the system searches, it never books or pays.

Safe by design

Validated before it’s trusted — not continuously retrained in place.

Component maturity

Not every component is in the same stage.

These statuses describe the platform today — not capabilities newly implemented by this website.

ComponentStatusNote
Departure → take-off → arrival chainIn productionEvent-driven, including rotation and aircraft-swap handling.
Airborne-time modelIn productionExperiment track runs in parallel.
Taxi-out / taxi-in modelIn productionRetraining guard and plan fallback.
Turnaround modelIn production"No squeeze" rule and pairing check.
95% departure and arrival prediction intervalsIn productionOn-screen display is being rolled out.
Decision casesIn productionPeople decide; nothing executes automatically.
Re-accommodation offersPilotSearch only, used inside decision cases.
Recovering time in the airIn evaluationAwaiting promotion decision.
Passenger connection riskEarly stageCurrently an empirical risk table.
Baggage connection riskPlannedInterface defined.

Getting started and integration

The estimate chain can start from the operational plan on day one.

Models contribute as sufficient airline-specific history becomes available.

Day one

  • Schedule with aircraft registrations.
  • Movement messages: off-block, take-off, landing and on-block.
  • Estimated times and delay updates.

Model phase

  • Operational flight plans, including airborne time, route, fuel, weights, planned speed and planned taxi.
  • Minimum ground times by aircraft type and station.
  • Historical operational data.

Decision phase

  • Passenger bookings with onward connections.
  • Historical fuel and speed settings.

Where available: airport milestones — TSAT, TOBT and CTOT. Data arrives as event messages. Estimates are made available for the airline’s operational systems to consume; the decision layer runs separately and reads those estimates.

Talk to us about predictive operations.

See how a continuously updated estimate chain fits into your operation.

Discuss your operational use case